
NB: This is a draft version and may be updated.  Please check
http://spin.riken.bnl.gov/ccj/doc/plan/ to obtain the latest version.

		           December  2, 1998  23:00 EST

			   Takashi Ichihara (RIKEN, RBRC)
                           Yasushi Watanabe (RIKEN, RBRC)
                           Naohito Saito    (RIKEN, RBRC)
                           Yuji Goto        (RIKEN)
                           Hideto En'yo     (Kyoto Univ., RBRC )
			   Hideki Hamagaki  (CNS, Univ. of Tokyo)
			   Shinya Sawada    (KEK)
                           Ryugo S. Hayano  (Univ. of Tokyo)

Contents
1. Introduction

   1.1 Overview
   1.2 Background
   1.3 Purpose of the CC-J
   1.4 Size of the CC-J
   1.5 Concept of the CC-J Facility

2. Requirements

   2.1    Physics
   2.1.1  Simulation
   2.1.2  Data Mining
   2.1.3  Physics Analysis
   2.1.4  General Computing

   2.2   System Requirement
   2.2.1 Annual Data Volume Requirement
   2.2.2 Disk Storage Requirement
   2.2.3 I/O Throughput Requirement
   2.2.4 CPU Requirement
   2.2.5 Software Requirement
   2.2.6 Network Switch requirement
   2.2.7 WAN
   2.2.8 Data Duplication

3. Facility Components

   3.1 Managed Data Server (HPSS + SMP Server)
   3.2 CPU Farms for Analysis and Simulation
   3.3 Software
   3.4 Network Switch
   3.5 WAN
   3.6 Data Duplication at RCF (DST)
   3.7 Human Resources

4. Construction plan

   4.1 Construction Plan
   4.2 R&D for CC-J at BNL

5. Operation

   5.1  Relationship between RCF, PHENIX and CC-J
   5.2  Organization of the CC-J
   5.3  Operation of the CC-J
   5.4  Relation to RCF

6. Cost and Personnel Overview

7. Summary

   References

   Appendix A1 (Simulation Requirement)
   Appendix A2 (Simulation Requirement for Spin Physics)
   Appendix B (US-Japan WAN Connectivity)


1. Introduction
Importantly, the planned capabilities of the CC-J are in concert with the research plans of RIKEN and RIKEN BNL Research Center, which initiated the RHIC spin program and which plan to expand their involvement in the entire PHENIX program.
The RCF can not meet the complete computing needs of the four current RHIC experiments, nor is it intended to. The RCF has been designated as the principle resources for raw data archiving and primary event reconstruction, and each of the experiments was urged to identify outside resources to address the rest of their computing needs. For instance, the STAR experiment is planning to use NERSC to fulfill a large part of their computing needs for event and detector simulation.
The idea of a PHENIX CC-J first arose three years ago through discussions among the Japanese PHENIX participants. Further discussions with the PHENIX Detector Council (DC) and Executive Council (EC) members were held to clarify the structure and purpose of the CC-J. The concept of the CC-J was very favorably received by the PHENIX collaboration, and it has become an integral and essential part of the overall PHENIX plan for computing.
Therefore, we propose to construct the PHENIX CC-J as a regional computing center at RIKEN over a period of three years beginning in 1999. RIKEN Wako headquarters has encouraged this project and they have promised to donate 100 TB of tertiary storage in the Tape Robot System of STK Powderhorn and four RedWood Tape Drives from the new RIKEN Super Computer System which will be installed in January 1999 and they will also provide HPSS software and hardware from the RIKEN general computing environments for CC-J Project. All these parts will be installed by March 1999.
| Dec. 1999 | Dec. 2000 | Dec. 2001 | |
| CPU farm (SPECint95) | 2400 | 5900 | 10700 |
| Tape Storage size (TB) | 100 | 100 | 100 |
| Disk Storage size (TB) | 5 | 10 | 15 |
| Tape I/O (MB/sec) | 68 | 90 | 113 |
| Disk I/O (MB/sec) | 200 | 400 | 600 |
| SUN SMP Server Unit | 2 | 4 | 6 |
Architecture of the CC-J follows that of the RCF (without reconstruction farm), and the identical key software products for database, HPSS etc, will be adopted. It should help keep compatibility in software, and facilitates the software development and maintenance.
Mechanism of exchange data and information needs to be established between the RCF and the CC-J.
DST or raw data transfer via network is not feasible, at least massively, in the coming few years. As is shown in the figure, data duplication facility has to be established in the RCF, in order to transfer DST's via postage. In reverse, a similar function is implemented in the CC-J side, in order to export simulation data and micro-DST. The duplication facility will be built both at the RCF and CC-J sides. As will be discussed in 3.5.1, we expect that the exportation of the simulation date will be available via the Internet in 2001.
We hope to have wider network bandwidth available in a year between US and Japan thanks to APAN project. With wide bandwidth available, database access and software update can be performed via network with minimum delay. On the database, replication method is the most favorable, and testing has to be initiated soon to verify this method. Keeping software compatibilities at PHENIX is performed using the AFS software, and wider bandwidth should assure smoother software accessibility.
In this chapter, the size of system is determined by the
following assumptions:
RCF will be utilized as the common computing environment
for the RHIC Project including STAR, PHENIX, PHOBOS, BRAHMS etc at BNL.
About 1/3 of the RCF resource is assumed to be used for
PHENIX. In this chapter, the estimate for the PHENIX requirement
is based on the report of
"PHENIX's Computing Requirement" by Soren Sorensen and
The PHENIX Offline Computing Group [3].
The PHENIX CC-J is the principle site of computing for PHENIX
simulation. The PHENIX CC-J needs to meet the requirement of the
entire PHENIX simulation. Concerning to the CPU requirement of the
simulation, we basically follow the work of
"PHENIX's Computing Requirement"[3].
We have incorporated
feedback from the Mock Data Challenge 1 (MDC-1) in the following
estimates. According to Ref. [3], it is required to simulate the
events of the order of 5M events for each year, which corresponds to
0.5% of the experimental data.
The size of the event by the simulation (PISA) is 6MB for one event.
This requires the storage area of 30 TB/year. According to the MDC-1,
the CPU required to generate one event is [11.9 K (central) + 40.0 k
(muon)] = 51.9 k SPECint95 sec. The CPU required to generate 5 M
events is 8200 SPECint95
Disk space for the workarea corresponding to the data amount of a
months (3.3TB) is required for the production and reconstruction.
2 Requirements
2.1 Physics Requirements
2.1.1 Simulation Requirement
  [Simulation Requirement]
  --------------------------------------------
   Storage (Sim. result)          30 TB/year
   Work Disk Area                3.3 TB
   CPU(event generation)        8200 SPECint95
   CPU(event reconstruction)    1300 SPECint95
   CPU(event analysis)           170 SPECint95
  ----------------------------------------------
The new estimate for the simulation requirement for spin physics is
described in Appendix A. It is suggested that
even with pT selected
simulations, which are efficient to minimize the CPU time, 7000 SPECint95
is required for background studies of spin physics to complete event
generation and event reconstruction.
Taking into account the variety of physics goals of PHENIX, we anticipate at least 10 independent micro-DST productions will be performed per year at CC-J. The micro-DST production is ultimately limited by the I/O speed of the tape drives. In the proposed CC-J system we can store the DSTs and the micro-DSTs of a half year ((150+45)/2= 97.5TB) in the tape drives. We need access them in 10 days and the required I/O bandwidth for the tape drives is about 112 MB/s. We think that this is a very moderate requirement, because the requirement for this I/O throughput in the ROCOCO report [1] is as follows: "Filter must be able to cull micro-DS T from 100 TB DST data set in 24 hours", which corresponds to 1160 MB/s I/O bandwidth. The table below summarizes the "Data Mining Requirements".
  [Data Mining Requirement]
  -----------------------------------------
   Storage (DST)               150 TB/year
   Storage (micro-DST)          45 TB/year
   I/O (tape Read)             112 MB/s
   I/O (HPSS-SUN SMP)          112 MB/s
  -------------------------------------------
One difference from Ref. [3] is the is the size estimate of the Data Summary Tape (DST). Although we learned that the size of the DST was 120% of that of raw data at the MDC-1, we expect this ratio will be improved and we assume that the size of DST is a half of that of raw data. We recognize that in the data mining the CPU requirement necessary to perform I/O is not significant.
Physics analysis will be performed for the micro-DST many times. We assume about 1/5 of the micro-DST is required to be resident in DISK: this corresponds the DISK storage of 9 TB. The Disk I/O bandwidth is important for micro-DST production, Physics analysis for micro-DST and also simulation production. Assuming that the access to the whole micro-DST on disk (9TB) can be done 5 times in a day, the required disk read bandwidths is more than 520 MB/sec.
   [Physics Analysis Requirement]
  -------------------------------------------
   Storage (micro-DST)          45 TB/year
   DISK Storage (micro-DST)      9 TB
   DISK I/O                    520 MB/s
   CPU(requirement)           1000 SPECint95
  -------------------------------------------
  Assuming there are 100 uses for the CC-J and each users
need 5GB as a permanent file, the required disk storage of the
user permanent files is about 500GB.


  [General Computing Requirement]
  ----------------------------------------------
   Disk Storage (permanent file) 500 GB
   CPU                           200 SPECint95
  -----------------------------------------------


 2.2  System Requirement


  2.2.1 Annual Data Volume Requirement

  The following table shows the current estimate of the annual data amount
for PHENIX experiment at the nominal year. The Raw data from the PHENIX
detector comes at 20MB/s and this yields 290 TB for each year.
Since the reconstruction of the Raw Data at the nominal year is out
of the scope of the CC-J, the storage for the Raw Data is not counted.
| Annual Data Volume | |||
|---|---|---|---|
| item | PHENIX | RCF-PHENIX | CC-J |
| Raw Data | 290 | 290 | 0 |
| Calibrated Data | 0.1 | 0.1 | 0.1 |
| Simulated Data | 30 | 30 | 30 |
| Data Summary Tape | 150 | 150 | 150 |
| uData Summary Tape | 45 | 45 | 45 |
| Total | ~515TB | ~475TB | ~225TB |
To handle the data amount, Hierarchical Storage System (HSM) with tape robotics and disk system, such as High performance Storage System (HPSS) is required. HPSS is developed at the Storage laboratory under DOE project. HPSS has been also adopted at many high-energy accelerator laboratories in the world.
To store the simulation results (3.3TB), a part of micro-DST (9 TB), user permanent file, and user work file, totally 15.3 TB of disk space are required.
  [Disk Storage requirement]
   simulation result    3.3 TB
   micro-DST            9   TB
   user permanent file  0.5 TB
   user work file       2.5 TB
  ----------------------------
   Total Disk          15.3 TB
For the long-term reliability and maintenancebility, this DISK system will be configured by RAID.
(a) Following I/O throughputs are required for Tape and Disk.
     -----------------------------------
     Tape I/O          112 MB/s
     Disk I/O          520 MB/s
     -----------------------------------
Following table shows the estimate of the CPU requirement for the PHENIX. A large portion of the CPU requirement of CC-J is occupied by the Simulation, because the PHENIX CC-J is the principle site of computing for PHENIX simulation.
Since CC-J does not reconstruct raw data in the nominal year, the event reconstruction part of the CPU for the experimental raw data is not necessary. This estimation shows the CPU requirement of the CC-J is about 11261 SPECint95.
| CPU Requirement | |||
|---|---|---|---|
| item | PHENIX | RCF-PHENIX | CC-J |
| Event Reconstruction | 6084 | 6084 | 0 |
| Data Analysis | 1700 | 1700 | 1000 |
| Theoretical Model | 800 | 0 | 800 |
| Simulation | 7991 | 0 | 8200 |
| Simulation Event Reconst. | 1300 | 0 | 1300 |
| Data Analysis of Sim. | 170 | 0 | 170 |
| Total | 18045 | 7784 | 11470 |
For micro-DST production, the CPU requirement is rather small and we assume that this can be done with the CPU's in the SUN SMP server.
Following environment of software are required: the PHENIX and RCF programming environments, including HPSS, AFS, Objectivity/DB, batch queueing system, UNIX programming development environments including C++, C, Fortran, perl and file-system backup package etc.
Since the PHENIX Programming environment relies on the AFS environment, we recognize that the mirroring AFS server for RHIC cell (for PHENIX portion) at the CC-J is important. Otherwise, in the case of network outage between BNL and CC-J, some influences will be appeared in the programming environment. This AFS mirroring can be done via WAN.
Replication of the experimental data bases such as calibration data base, tag data base etc. at the CC-J is also required. This can be also done using WAN.
Network switches are required to connect HPSS Servers, the SMP Data Servers, and the CPU farms. The bandwidth should be large enough to extract the performance of the HPSS System.
In order to exchange data between RCF and CC-J, a proper bandwidth of the WAN between RCF and CC-J are required. Also in order to access CC-J from the domestic and Asian collaborators, proper bandwidth with the domestic and Asian and Japanese institutes are required. These requirement will be discussed at section 3.4 with plan.
In order to produce micro-DST from DST, it is required that the DST will be duplicated and imported from RCF to CC-J. The simulation output produce by the CC-J is required to be exported to the RCF.
This will be discussed in section 3.5.
Following figure shows the schematic diagram of the PHENIX CC-J.
Following list shows the major facility component of the CC-J.
Since the architecture of the CC-J essentially follows the RCF [1,2],
detailed explanation for the part common to the RCF is omitted in this session.
HPSS Hardware consists of 5 node of SP2, each node is
connected to each other using SP Switch at the 300 MB/sec I/O
performances. Each SP2 node consists of quad Power PC 604
CPU (16.4 SPECint95/cpu), 512 or 1024 MB Memory, Differential Fast/Wide
SCSI interface, a SP switch interface of 300MB/s and 100BaseT
interface. Two RedWood drives will be connected to each SP2 node.
For the external network connection, a SP Switch Router, which
has a HIPPI interface (100MB/s) and 8-port 100BaseT interface, is
connected to the SP2 Switch and all the I/O to the LAN will be
carried out via this SP2 Switch router.
Since the I/O throughput between the HPSS servers and SUN SMP
servers is crucial to the tape I/O bounded operation such as
data mining, we will
use 800Mbps HIPPI interfaces and HPSS Switch instead of multiple
100BaseT interfaces. Currently 1000BaseT (Gigabit Ethernet) is
not supported for the SP2. In addition,
it is reported that the performance of HIPPI is better than
that of 1000BaseT.
According to the report of
http://www.ods.com/white/whi_0009.shtml, it is reported that
This disk storage system consists of 30
Raid file systems. Each Raid5 system consists 11 units of 50 GB
(data+parity) disk and one hot- standby disk (totally 12 disks).
3.5" size 50 GB disk with 15-25MB/s transfer rate will be
available in 1999.
15 TB consists of 30 sets of Raid5 file system,
which consists of 330 unit of (data+parity) disk and 30 unit of
hot-standby disks.
When a disk failure occurs in a Raid5 system with hot-standby disk,
failed disk will be cut off to off-line and
hot-standby disk
will be connected in place and rebuilding process
occurs automatically.
During the
rebuilding process, the read/write access to the data on this
file system is available. After the rebuild is finished, this
raid5 system returns to a normal operation mode. The disk failure
will be notified to the operator by E-mail and some indicator, and
the failed disk can be hot-swapped at any time without
affecting the system operation.
Adopting Raid system is very important in the point of
security and reliability of the data and maintenancebility for
the entire system. Assuming the 500,000 hours of Mean Time
Before Failure (MTBF) of each disk, which is typical values
for high-performance disk, the disk failure rate for the system
using 300 disks is one every 2 months statistically.
By adopting the Raid system, interference on the system
operation by the disk failure will be eliminated.
Possible disadvantage in adopting the RAID system is
degradation of the write performance, which is expected by
parity calculation and parity writing. In the most case, however,
the number of read operation is many times larger than that of
the write operation and then this will not make a serious problem.
Nevertheless, if high-write performance for the file system is
required for some parts, these parts of the disk file system can
be configured with NON-RAID configuration.
Totally 15TB of disks are connected to these servers.
Each server is equipped with 1000BaseT.
Six units of the SMP server will satisfy the 600 MB/s
networking I/O as well as Disk I/O. These servers are
NFS-mounted from client computers.
These servers are also connected to the IBM SP2 HPSS server
via HIPPI interface and HIPPI switch. Access to the HPSS
will be done by pftp command over the HIPPI Interface.
Since data mining from DST to micro-DST is I/O bounded operation
but not CPU bounded, data mining should performed
mostly on these SMP Data Servers.
The CPU farm consists of 300 unit of pentium II processors. The
configuration of each CPU box is almost identical to that of RCF.
Prototype of this CPU farm which consists of 20 Pentium II (450 MHz)
processor is now working at BNL as described in session 4.2. In
Ref [1], it is assumed that the SPECint95
performance of the Pentium II becomes twice for every 2 years and this
is true for the last two years, we adopt the same assumption. Then the
SPECint95 of the Pentium II and CPU farm will be expected as follows.
Total performance of 300 CPU units is estimated to be 10730
SPECint95, which almost satisfies the requirement.
The network switch with the performance above will be installed.
We are going to have wide network bandwidth available between
US and Japan thanks to APAN (Asia-Pacific Advanced Network) project.
APAN is a non-profit international consortium, and is intended to
be a high-performance network for research and development on advanced
applications and services (see http://www.apan.net/). The US-Japan
leased line of the APAN is supported by the Science and Technology
Agency (STA) Japan.
PHENIX collaborating institutes in Japan including RIKEN, CNS Univ
of Tokyo. etc submitted two proposals of using APAN for the PHENIX
project in summer of 1997 and these proposals have been approved.
APAN stated operation in September of 1998 with 35 Mbps US-Japan
leased line and this line is scheduled to be upgraded at 70 Mbps
in January 1999. This US-Japan leased line is available only for
limited sites of authorized APAN institutes including RIKEN, CNS,
Univ. of Tokyo, Kyoto Univ. etc and as a result, we expect that
a relatively high bandwidth of the APAN US-Japan leased line
will be available for the PHENIX project.
With wider bandwidth available, database access and software update
can be performed via network with minimum delay. On the database,
replication method is the most favorable, and testing has to be
initiated soon to verify this method. Keeping software compatibilities
at PHENIX is performed using the AFS software, and wider bandwidth
should assure smoother software accessibility. The mirroring of the
AFS server at CC-J is also in consideration.
The detailed of the US-Japan WAN connectivity is described in
Appendix B.
The following Table shows the brief idea of the BNL - CCJ WAN
utilization in the coming years. The real bandwidth
availability and utilization depend strongly on the future
bandwidths and traffic conditions of the APAN US-Japan line, ESnet backbone,
and BNL-ESnet connection. We assume that
10% of the APAN US-Japan bandwidths is available for the
connection between RCF and CC-J, since there are about 20 applications approved
in APAN-Japan and two of them are PHENIX applications.
We assume that the interactive sessions and mirroring and
replication of the experimental Data base, and same experimental
data transfer will be done via the Internet. For the interactive
session, typical required bandwidth per one X-terminal session is
100 Kbps as described in the Ref [1].
The required bandwidth is 12 Mbps to transfer simulation result
of 30TB/year from CC-J to RCF assuming 65% utilization of the
bandwidth.
We expect that this bandwidth will be available in 2001. There is
a possibility that the entire simulation result will be transfered
via the WAN at that term.
Until these bandwidth becomes available, the data transfer for
these will be done via the SD-3 Cartridge Tape (50GB/cartridge)
with RedWood drive.
N.B. Round Trip Time (RTT) between BNL and Japan is governed by
light velocity in optical fiber and the length of the fiber between
Japan and US. This RTT is no less than 150 m sec. We need some kind
of R&D study in order to extract good performance with relatively
large RTT WAN environment.
In order to export the DST to CC-J, Data Duplication Facility
will be prepared at the RCF. The main components of the facility
are (1) two RedWood tape drives to write DSTs and (2) one (IBM)
tape server to connect these tape drives.
A planning duplicating method is following:
1) Pulling out a reconstructed data file from the HPSS to a disk
(normal unix file system) on the tape server with using pftp,
just after the file putting in the HPSS and before purged from
cache disks on HPSS.
Absence of the data export/import function of HPSS causes such
rather complicated method. The method will be replaced by the
function of HPSS, when it will be available. We are requesting
to the HPSS developer the function to be realized at the HPSS
Release 4.2 which is expected to be released in the end of 1999.
Two RedWood drives for the Data Duplication Facility are minimum
requirement from the data throughput point of view as following.
Maximum throughput of one RedWood drive (11.25 MB/s) is almost
same as the required DST production rate (10 MB/s) which
assuming DST has 1/2 size of raw data.
This means one RedWood drive does not have enough contingency
for the data exporting and also the facility will be used as
importing simulated data from CC-J.
An adoption of high capacity tape media as the RedWood
contributes to make smaller labor cost for tape handling
(putting in/pulling out tapes to the robotics, packaging for
transport etc.
Success of the CC-J depends much on the quality of
system management and operation we can obtain. Estimated cost
of system management and operation (one SE and two operators in the
current plan) is high, and this is primarily because of a special
situation in Japan that these specialists will not be employed but
will be provided from companies via maintenance contracts. We
can expect close-to-excellent support from the companies.
In order to design, re-design, and maintain the HPSS system, a
special system engineer who has sophisticated knowledge and experience
of HPSS is required at full-time base at the CC-J.
To handle duplicated tapes at RCF, we expect that 0.5 FTE operator or
technician is required to be allocated at the data duplication facility
at the RCF. We are now discussing with RCF how to prepare this
workforce.
To design and maintain the hardware architecture, a technical manager
is required at full-time base time.
3. Facility component

3.1 Managed Data Server (Storage System)
1. Tape Robot
The capacity of 100 TB can handle data of half years on line.
Other data are stored at off-line shelves. This on-line/off-line
storage ratio is same as RCF.
2. Tape drive unit
3. HPSS System
The HPSS Release 4.1 software and hardware will be installed at
RIKEN Wako in March 1999 as a part of RIKEN general computing
environment and they are dedicated to the CC-J
project. Contract between RIKEN Wako and IBM Japan for the
HPSS hardware and software was concluded in November 1998.
It might be expected that the performance of the Gigabit ethernet will be
improved in a near future with the increase of the CPU performance. For the
connection between pentium II CPU farms and the HPSS servers, we are planning
to use 8 sets of the 100BaseT interface from SP router.
4. Disk Storage System
5. SMP Data Server
6. Special Servers
3.2 CPU farm
CPU Performance
SPECint95 purchase unit Total SPECint95 1998 Sep. 17.2 0 0 1999 Sep. 24.3 100 2430 2000 Sep. 34.4 100 3440 2001 Sep. 48.6 100 4860 Total 300 10730
3.3 Software component
3.4 Network Switch
3.5 WAN
3.5.1 US- Japan connectivity and APAN
  CCJ-BNL WAN Utilization future estimate

     Year     CC-J Total  CC-J int.  CC-J non-inter. (APAN US-JP)
     -----------------------------------------------------------
     1998     3.5 Mbps     2 Mbps      1.5 Mbps       35 Mbps
     1999      7  Mbps     4 Mbps       3 Mbps        70 Mbps
     2000     15  Mbps     7 Mbps       8 Mbps       (155 Mbps)
     2001     31  Mbps    10 Mbps      20 Mbps       (310 Mbps)
  Required bandwidth to transfer data over WAN

    Data amount /year   100% utilization    65% utilization
    -------------------------------------------------------
      30 TB (simulation)    7.6 Mbps           11.7 Mbps
     150 TB (DST)          38.1  Mbps          58.5 Mbps
To transfer a DST of 150TB/year from RCF to CC-J, The required
bandwidth is 60 Mbps assuming the 65% utilization of the bandwidth.
to transfer a DST of 150TB/year from RCF to CC-J.
We suppose this bandwidth will be available in 2003 or later. 3.5.2 domestic connectivity
We plan to use HEPNET-J as well as IMnet and SINET
for the domestic WAN connections with PHENIX-J collaborating
institutes. 3.6 Data Duplication at RCF (DST)
2) Copying the file to a tape with using standard "tar" or "dd".
3.7 Human resource
  items                                   requirement
 --------------------------------------------------------------
  technical manager                       1  full time equiv..
  user support 				  1  full time equiv..
  programming consultant	          1  full time equiv.
  system engineer                         1  full time equiv.
  operator                                2  full time equiv.
  ana/sim production coordinator          2  full time equiv.
  operator at RCF for data dup.           1  full time equiv.
| item | Mar. 1999 | Dec. 1999 | Dec. 2000 | Dec. 2001 |
| CPU farm (number) | 0 | 100 | 200 | 300 |
| CPU farm (SPECint95) | 0 | 2400 | 5900 | 10700 |
| Tape Storage size | 100 TB | 100 TB | 100 TB | 100TB |
| Disk Storage size | 0.3 TB | 5 TB | 10 TB | 15TB |
| Tape Drive (number) | 4 | 6 | 8 | 10 |
| Tape I/O (MB/sec) | 45 | 67.5 | 90 | 112.5 |
| Disk I/O (MB/sec) | 50 | 200 | 400 | 600 |
| SUN SMP Server Unit | 1 | 2 | 4 | 6 |
| HPSS Server SP2 node | 5 | 5 | 5 | 5 |
CPU power achieved by the 300 PC's is about 10700 SPECint95 which is about 1/2 of the total CPU power of the RCF (17500 SPECint95). CPU power of the PC's matches the requirement of ~9000 SPECint95 from entire simulation tasks of the PHENIX experiment.
The micro-DST production is ultimately limited by I/O speed of tape drives. Total of eight tape drives will yield the maximum data transfer speed of 90 MB/sec, which is a little less than 1/2 of the current RCF proposal of 200MB/sec. We believe capability of the CC-J as an analysis center can be very high with this high I/O bandwidth. Additional tape drives or Storage Robots will be added, if needed.
Preparation for "specification" for the Phase 1 purchase of the CC-J will start early 1999. The budget for the CC-J Phase 1 construction will be available in April 1999, if there is no delay in the approval in the Diet. Then we will start the process of bid for the Phase-1 purchase. On this schedule, the installation of the phase 1 devices will be in September or October 1999. We plan to start the CC-J operation in December 1999.
The startup of the HPSS is scheduled on March 1999 with rater limited hardware resources. The main concern of the HPSS at this point is the data transfer between SUN SMP servers and IBM HPSS servers with several 100BaseT HIPPI interfaces.
In April 1998, R&D for the
1. Prototype of data duplication facility
2. Prototype of simulation and data analysis hardware
has been started at BNL as a part of activity of the
Experimental Group of RIKEN BNL Research Center (RBRC).
Next figure shows an idea of duplicating facility of DST for CC-J at RCF. To facilitate, we are planning to install one tape drive (RedWood) and one tape server to connect tape drives as a prototype in JFY 1998. It will be occurred at when RCF will purchase more drives before MDC-2. We will add one more tape drive (RedWood) in JFY 1999. We are also planning to share the STK tape robot at RCF for this DST duplication and detailed method is currently under discussion with RCF.

As a proto-type of the CC-J CPU farm, we have constructed CPU farms consists of 20 pentium II CPU at 450 MHz and one SUN E450 (4-CPU) file server. This system was completed in October 1998 and installed at the RCF machine room and working very stably. In the SUN E450 server, the user file system of 45GB is consists of RAID system with hot stand-by disk, which assure the reliability in the case of disk failure. In a standard rack, 8 Dell PC's with dual Pentium II processor (totally 16 CPU) are mounted. Each PC and SUN E450 server are connected to a high performance Network switch (CISCO 2916M) at 100BaseT and this switch is connected to the RCF LAN. In order to assure security of the system, ssh connection is required to connect this system and "TCP Wrapper (tcpd)" is configured tightly to accept the connection only from proper sources. Also all the recent security patches for the Operating systems have been installed.

The spin-physics simulation production with PHENIX simulation program (PISA) and STAF is now carried on. Also evaluation for important technical information, such as NFS read and write performance of Linux, CPU performance for PHENIX software, etc are in progress. Also test for the arla software (FreeWare version of the AFS client) has been in progress and it (arla) has been working stable. These date are very important to design the CC-J system.
The next table summarize the organization
of the CC-J.
+-------------------------------------------------------------------+
| |
| CC-J director M.Ishihara |
| |
| CC-J Advisory Board |
| |
| Planning and Coordination Office |
| manager T.Ichihara (RIKEN and RBRC) |
| technical manager Y.Watanabe (RIKEN and RBRC) |
| scientific programming coordinator |
| H.En'yo (Kyoto and RBRC, Phenix-EC) |
| H.Hamagaki (CNS-U-Tokyo, Phenix-EC) |
| N.Saito (RIKEN and RBRC) |
| computer scientists |
| user support 1 (TBD) |
| program development 1 (TBD) |
| |
| Technical Management Office |
| manager Y.Watanabe (RIKEN and RBRC) |
| System engineers 1 (TBD) |
| System operators 2 (TBD) |
| |
+-------------------------------------------------------------------+
Advisory Board is formed under the request from the director to make
advice on the guide-line of the CC-J operation. PHENIX spokesperson and
PHENIX computing coordinator are natural members of this board.
The Planning and Coordination Office (PCO) is responsible for
operation of the CC-J.
PCO distributes the computing resources to the individual computing
projects in order to maximize the physics outputs. PCO is also responsible
for making an effective plan and its realization
for the development of the CC-J hardwares and softwares to match the
PHENIX analysis requirements.
PCO includes some of Japanese members of PHENIX Executive Council
(EC) to coordinate regularly the operations and the developments of the CC-J.
Proposals for a PHENIX computing project in the CC-J
are to be submitted to this office. User supports for the accepted projects
are also PCO responsibility.
The conflicts between computing projects are to be solved through
this office. The manager of PCO can also expect Advisory Board's
opinion on some severe conflicts.
The Technical Management Office (TMO) is responsible for running
the entire CC-J system alive. TMO is the sub office of PCO and
responsible for maintenance and operation of the CC-J system.
The development plan of the CC-J should be primarily reviewed in
this office.
CC-J PCO expects that any large PHENIX computing project to be
performed in the CC-J is reviewed in the PHENIX physics
working groups under the guidance of CC-J PCO and the consultation
of the PHENIX computing coordinator.
The proposal should be submitted to
CC-J PCO in advance to invoke the procedure for approval
which will be given after PCO studies the feasibility of project.
PCO reserves the authority for distribution
of CC-J resources to the approved projects, in order to maximize the
physics outcomes along the general goals imposed to the CC-J and to
cope with the plan for the development of the CC-J.
CC-J PCO may requires an individual computing project to assign a
Japan-resident contact person, in order to avoid conflicts among
the projects or un-thoughtful job-submissions which cause a loss of the
CC-J system performance.
CC-J PCO is responsible to establish mutual connectivity and transparency
between RCF and CC-J. To clear the relation among RCF and CC-J,
MOU may be prepared when needed. The major issues newly required in the
RCF site for the sake of the CC-J operation are;
We estimate that the total construction cost of the CC-J for
three years (JFY 1999-2001) is 435 M Yen (about $ 3.5 M).
We are to request the budget of 203 M Yen
( 145 M Yen for the construction and 58 M Yen for the operation)
to the Science and Technology Agency (STA) Japan
through RIKEN-BNL Research Center.
This initial budget
corresponds to 1/3 of the full CC-J scope.
In Summary, the PHENIX CC-J, if realized as a plan, will become
an attractive regional computing center of the PHENIX experiment.
It will serve as the major computing resources for PHENIX
simulation and a major resource for data analysis.
Significant gain for the physics outputs is expected both in the
heavy-ion physics and spin programs.
[2] Offline Computing for RHIC,
M. Baker, J.Flanagan, B. Gibbard, K. Hagel, T. Healy, S. Kumar, W. Love,
E. Nicolescu, D. Olsen, C. Price, L. Ray, T. Schlagel, S. Sorensen, A. Stange,
T. Thowe, F. Videvaek, R. Healy, R. Houge, G. Rabinowitz, D. Stampf,M. Strongson,
G. Tsai, July 20 1997,
http://www.rhic.bnl.gov/html/reviews/proposal.ps
[3] PHENIX's Computing Requirement, Soren Sorensen and The PHENIX
Offline Computing Group, November 24, 1997,
http://uther1.phy.ornl.gov/offline/requirements/PhenixComputingRequirements.html
Following document is taken from Ref. [3],
PHENIX's Computing Requirement, Soren Sorensen and The PHENIX
Offline Computing Group, November 24, 1997,
Each PISA event is about 8 M Bytes, so the total amount
of simulated raw data annually will be 5,000,000 * 8 MBytes = 40
TBytes.
For example, in the measurement of the gluon polarization via asymmetry
for prompt photon production, we need to know the performance of EMCal
especially photon reconstruction efficiecy, two shower separation, hadron
rejection, and energy and position resolutions. We have already have some
beam test data for EM calorimeter and simulation will be be well-tuned
to reproduce the test results.
In the analysis procedure, we will employ the method called "isolation
cut" to enhance the prompt photon sample with respect to other backgrounds
such as pi0 and eta. Such cut should be optimized for our experiments and
optimization requires the full-fledged QCD event generator such as PYTHIA
and HERWIG, since the cut efficiency and so on will depend on event structure.
In the case of PHENIX, careful studies are irreducible especially
due to its limited solid angle.
Finally the measured asymmetry should be related to gluon polarization
Delta
G(x). A
very crude approximation is to assume that xgluon=xquark=xT=2pT/vs
as
schematically shown in the Figure 1. However, we can have better estimation
for kinematics of partons using QCD event generator. In addition, we can
test any models against our measured data using event generator.
Figure 2 shows the predicted asymmetry for prompt photon production by
using event generator and models on polarized gluon distribution. As will
be discussed later, these model calculations for background require significant
amount of CPU time, if we were to use fully detailed simulation. In addition,
we may have to try several models on polarized parton distributions, which
is also time consuming.
There are requirements for some different types of simulations to achieve
physics results from our measurements. We try to estimate the required
CPU time for simulations by describing the case of prompt photon analysis
in this document.
Figure 1 Schematic view of the prompt photon production.
To evaluate the produced number of prompt photons, first, background
photons for which we can identify its source are discarded by applying
some cuts.
Next, number of background photons which cannot be discarded is
estimated using Monte Carlo simulation.
The number of the prompt photon after the cuts is estimated by
subtracting the number of background photons from that of all photons
after the cuts.
The major background for the prompt photon comes from pi0 decay to two
photons.
If both two photons are detected by the EM calorimeter, we can identify
their source by calculating their invariant mass.
This process is called "reconstruction cut".
If one photon escapes from the detector, source of the other photon
cannot be identified.
These photons remain as background.
When pi0 has large energy and angle of decay photons are too small, EM
calorimeter cannot discriminate them from each other.
They merge and are recognized as one cluster, which also remain as
background.
We cannot identify source of photons from other decay mode of pi0 and
those from decay of other hadrons, either.
For these background photons, we apply "isolation cut".
Origin of pi0 and hadrons which make background photons is fragmentation
of final quarks and gluons.
The photons are included in the QCD jet.
This means there are many hadrons around the photon.
The isolation cut requires energy sum of hadrons around the photon must
be smaller than some limit value.
The prompt photon are emitted to opposite direction of quark or gluon.
It can survive the isolation cut with high efficiency.
Some hadrons are mis-identified as photons by the EM calorimeter
analysis.
We have also bremsstrahlung photon which originate from the apparatus.
These are backgrounds which survive both cuts.
In order to estimate the number of background photons after these cuts
and to know efficiencies of the cuts for the background photons and for
the prompt photons, we utilize Monte Carlo simulation.
In next subsection, requirements of this Monte Carlo simulation will be
discussed.
In this subsection, we don't care about backgrounds from hadron
mis-identification nor bremsstrahlung.
These requires analysis code and detector simulation respectively.
These must be done using huge CPU power at the CC-J.
For the asymmetry calculation, we need to know effects given by
asymmetries of the backgrounds.
By analyzing pi0 identified by the invariant mass reconstruction, we can
evaluate its asymmetry.
We don't discuss about this analysis in this document.
To extract prompt photon, simulated background photons are subtracted
from all experimental photons after the cuts.
In the subtraction, statistical error of the simulated background must
be comparable to that of the experimental photons.
Next table shows estimated number of background photon which is
determined to have same statistical error as that of all photons in the
previous table.
One exception is p_T range 5 - 10 GeV/c.
We don't need precision better than 1% because there are other error
factors worse than 1%.
By subtracting the background photons from all photons, we get
estimation of the prompt photon after the cuts as shown in next table.
Figure below shows the number of all photons, prompt photons and
background photons.
In order to estimate number of the prompt photon before the cuts,
efficiency of the cuts is necessary.
This is also estimated by the simulation.
The table above for the prompt photon before the cuts show necessary
numbers for the simulation.
Error of the efficiency should be comparable to that of the number of
the prompt photon after the cuts.
As well as the case of the necessary number of the simulated background
photons, the simulated prompt photon do not need precision better than
1%.
Table below shows the number of the prompt photon before the cuts, which
we want as a final result.
The statistical error is quadratic sum of that of the subtraction
process and that of the efficiency correction.
Figure shows the final estimation of the prompt photon yield with its
error.
We need 33,000 prompt photons to be simulated in the p_T region from
5GeV/c to 30GeV/c.
On the other hand, 141,000 background photons are necessary to be
simulated as shown in next table.
If we limit the p_T region from 10GeV/c to 30GeV/c, 20,000 prompt
photons and 37,000 background photons are required.
In next table and figure, we summarize the evaluated efficiencies and
their errors of the cuts for the prompt photon and the background
photon.
In the above, we considered only 7 p_T bins.
When variation of the efficiency in one bin is big, we must set finer
bin size to decrease uncertainty of the evaluated number of photons in
the bin.
Binning of acceptance in rapidity and azimuthal angle direction is
necessary to be considered, especially to evaluate effects of
non-orthogonal incident angle and edge of the EM calorimeter.
By considering variation of the efficiency, total number of the bins
are determined and quantity of required simulation is determined.
If we want to generate the required number of photons as explained in
the previous subsection, number of prompt photon events to produce
prompt photons and number of QCD jet events to produce background
photons are following;
Usually such study requires monte-carlo event generation, especially
if the analysis or study are relevant to event structure, such as particle
correlation, multiplicity, and so on, we need to utilize so called QCD
event generator, e.g. PYTHIA. Since event generation itself is time
consuming in addition to the detector response simulation, we need to organize
the tasks in efficient way.
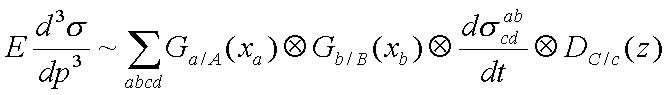
After a short overview of QCD jet production, we propose an efficient
method to save CPU time.
The cross section of this reaction can be written as
Figure 5 shows the fraction of contribution from subprocess to jet production
as a function of pT of jet. In the lowest pT
region, gluon-gluon scattering is the dominant process, at mid-pT
quark-gluon scattering is the main source, and at high-pT
region quark-quark scattering dominates the production.
In unpolarized experiment, we do not care even a background comes from
gluon-gluon scattering or quark-gluon scattering. However, in polarized
case, we DO care since different process will contribute to asymmetry differently.
Table 1 summarizes the cross sections for QCD processes at the leading
order for pT>2.0 GeV/c.
5. Operation
The organization of the CC-J is planned to fulfill the following
issues;
1: Establish effective and transparent operation for the PHENIX simulation
and data analysis project.
2: Activate Japanese and Asian interests maximumly and establish the
computing resources for them.
3: Keeping good contact with the RCF and PHENIX computing organizations.
4: Best usage of present human resources available at RIKEN and RBRC.
The organization reflects the relation of the CC-J to the RCF and PHENIX
which is schematically shown in the figure below.
CC-J Director is responsible for the entire CC-J project,
and should be acting as a spokesperson of the project both
for RIKEN-Wako and RBRC.

5.1 Organization of CC-J
5.2 Operation of CC-J (Relation to PHENIX)
5.3 Relation to RCF
    export of Data Summary Tapes  and import of Simulation Data Tapes
    replication of Objectivity Database over the WAN, and
    mirroring AFS over the WAN
While the CC-J is going to prepare necessary new hardwares in the RCF site,
adjustment of the scopes of responsibility of RCF and CC-J is on going.
For the duplication of data tapes, necessary manpower coordination will
be subject to an agreement among RCF, CC-J and PHENIX.
6. Cost and Personnel Summary
7. Summary
References
[1] Interim Report of the RHIC Off-line Computing Committee (RococoII),
B.S. Kumar, M.D. Baker, H.J. Crawford, B.G.Gibbard, K.Hagel, D.L. Olson,
R.L. Ray, R. Seto, S.P. Sorensen, T.G. Throwe, G.R. Young, Yale 40609-1179,
October 16, 1995,
http://www.rhic.bnl.gov/html/planning/rococo2/interim_report.ps
Appendix A1 : Requirement of Simulation
Simulated Data Volume
In general we want to track all the theoretical data through
GEANT in order to compare to our data. The most important contribution
for GEANT CPU time for PHENIX is however the calculation of acceptance
and efficiencies by the "particle gun" method in which the total possible
acceptance of PHENIX is bombarded uniformly with particles, which then
are embedded in real events (or simulated events before we have any real
data) and reconstructed using the same software as for the raw data. PHENIX
will need in the order of 30,000 acceptance cells, corresponding to 3-10
cells in each of the following dimensions: rapidity, Pt, azimuthal angle,
vertex position, total hit multiplicity and particle species. In each cell
we will require an accuracy of 1% thereby requiring 10,000 particles being
deposited in each cell. Annually we need in the order of 10 different tables
corresponding to different magnetic field strength, detector configuration
etc. This leads to a total need of 30,000 * 10,000 * 10 = 3 G Particles.
Since PISA currently tracks about 1000 particles in PHENIX's active volume
this corresponds approximately to 3M events annually in addition to the
approximately 2M needed for the theoretical models.
Simulation CPU Need
The equivalent of 5,000,000 events have to be tracked through
PISA each year. Each event will require 43 kSPECint95*sec resulting in
7600 SPECint95. A slightly more detailed calculation taking
the differences between the central and the muon arm into account leads
to final value of 8000 SPECint95.
This is a very large number, which we hope to be able to reduce by developing
more efficient fast detector simulation software. However, fast simulators
will most likely also result in a new need for larger samples of "phase-space"
correct particle distributions from event generators in order to estimate
the background for rare processes like Upsilon production.
Simulated Data Reconstruction CPU
For our estimates we have assumed the
calculation of efficiency tables will dominate PHENIX's requirements for
simulated data reconstruction. Annually 3G tracks are created and in principle
each of these tracks will have to be independently embedded in a real event
which would result in the reconstruction of 3 billion events, which are
3 times more than the number of real events from the detector. However,
it is assumed that we can embed 10 particles in each event as long as they
are chosen not to overlap. This reduces the total number of reconstructed
events to 300 million annually, which will require 300,000,000 * 120 SPECint95*sec
/ 31556736 / 0.9 =~ 1300 SPECint95.
This number also includes a small contribution of 22 SPECint95 for reconstruction
of the theoretical models.
Simulated Event Summary Data Volume
The data volume of a simulated event is
much larger than a real raw event due to the additional information stored
concerning the hit and track origin of the counts in each channel. The
hit information data volume has already been estimated in the section on
the simulated data volume. The simulated event size will be (in kBytes):
300 (raw data) + 300 (referential data to hit/track info) + 750 (intermediate
objects) + 18 (pure event summary data) =1368 kBytes. However, only a small
fraction of all the reconstructed data for efficiency calculations needs
to be stored for later reference. We estimate 1%. We will therefore annually
store 2,250,000 (theoretical models) + 1% * 300,000,000 (efficiency calculation)
= 5.25M events. The total data volume will therefore be: 5,250,000 * 1368
kBytes = 11 TBytes.
Data Mining of Simulated Data
Naturally the data mining of the simulated
data will be done much less frequent. We estimate that only 10% of all
data mining queries will be done on the simulated data corresponding to
a total of 30 queries a year.
However, whenever a query is done to that data all of it will have to be
considered, which annually is 40 TBytes (Simulated hits) + 11 Tbytes (ESD)
=~ 50 TBytes. This data will,
however, be naturally clustered, since in general the queries will be limited
to extracting the information from a particular run for a theoretical model.
We will therefore not put much emphasis on the reliability of the numbers
estimated in this section, since the data mining of simulated data will
not stress the MDS due to the very high degree of natural clustering of
the data.
Appendix A2 : Simulation Requirement for Spin Physics
Simulation Requirements for Spin Physics
Yuji GOTO and Naohito SAITO
RIKEN / RIKEN BNL Research Center
Abstract
We estimate CPU time required for CC-J by picking up typical physics
topics, prompt photon measurement. Simulations for background study will
be very CPU intensive. Even with pT selected simulations, which are efficient
to minimize the CPU time, about 500 SpecInt95 is required for signal and
background studies of spin physics to complete event generation and event
reconstruction.
1. Introduction
As in any other experiments, simulations studies are inevitable for
physics analysis in PHENIX for following reasons:
(a) confirming our understanding of the detector performance,
(b) evaluating systematics involved in the analysis procedure,
and
(c) interpreting the experimental results.
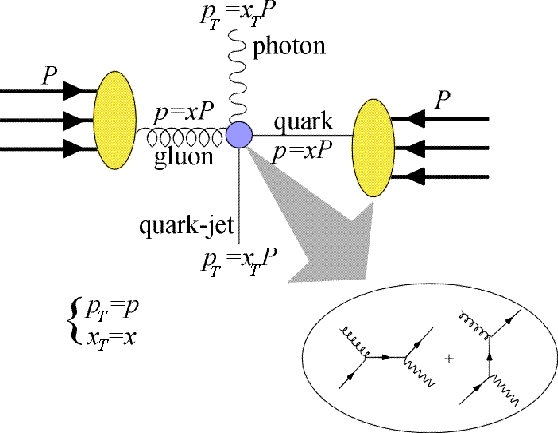
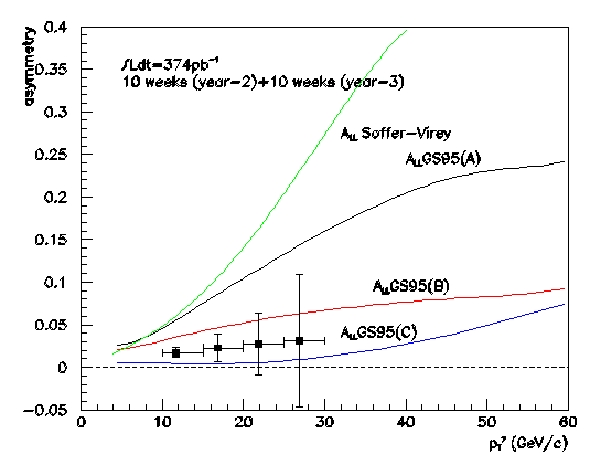
Figure 2 Model calculation of asymmetry ALL
for prompt photon production
and projected errors of PHENIX measurements with Ldt=320 pb-1.
2. Example: Prompt Photon Analysis
2. Example: Prompt Photon Analysis
2.1 Outline of the Analysis
In order to extract asymmetry of the prompt photon from the experimental
data, we evaluate produced number of the prompt photons for each beam
polarization, i.e. parallel or anti-parallel.
In this section, we discuss statistical error which originate from
the calculation process of the produced number of the prompt photons.
(prompt photon after cuts)=(all photons after cuts)-(background photon
after cuts)
Finally, the number of the prompt photon before the cuts is estimated
by correcting the cut efficiency.
(prompt photon before cuts)=(prompt photon after cuts)/(cut efficiency)
This is the produced number of the prompt photon which we want.
2.2 Simulation Requirements
We require quantity of the simulation so that statistical error of the
simulation is not a main error factor of the asymmetry calculation.
For the estimation of the required quantity, we need to know rough
produced numbers of the prompt photons and background photons.
We used PYTHIA event generator for this purpose.
For sqrt(s)=200GeV, prompt photons were generated using the prompt
photon generator, and background photons were generated by the QCD jet
generator.
2.2.1 Requirement for Number of Photons
Next tables show estimated number of all photons, sum of the prompt
photons and the background photons, before and after the cuts.
Luminosity to produce these numbers of photons is 320pb^-1 to consider
10-weeks run after year-3 of the RHIC run (full luminosity).
Using these numbers, statistical errors from the experiment are
estimated and shown on the tables.
Figures show the same numbers of all photons, the prompt photons and the
background photons before and after the cuts.
p_T range (GeV/c)
experiment #event
statistical error
statistical error (%)
5-10
17545748
4188.76
0.02
10-15
358431
598.69
0.17
15-20
30657
175.09
0.57
20-25
4739
68.84
1.45
25-30
1094
33.08
3.02
30-35
267
16.34
6.12
35-40
62
7.87
12.70
sum
17940998
p_T range (GeV/c)
experiment #event
statistical error
statistical error (%)
5-10
2895442
1701.60
0.06
10-15
107981
328.60
0.30
15-20
13785
117.41
0.85
20-25
2783
52.75
1.90
25-30
673
25.94
3.85
30-35
169
13.00
7.69
35-40
41
6.40
15.62
sum
3020874
p_T range (GeV/c)
experiment #event
statistical error
simulation #event
statistical error (%)
5-10
1527722
15277.22
10000.00
1.00
10-15
15266
328.60
2158.26
2.15
15-20
523
117.41
19.84
22.45
20-25
201
52.75
14.52
26.25
25-30
81
25.94
9.75
32.03
30-35
26
13.00
4.00
50.00
35-40
6
6.40
0.88
106.72
sum
1543825
12207.24
p_T range (GeV/c)
experiment #event
statistical error
statistical error (%)
simulation #event
statistical error (%)
5-10
1367720
7261.13
0.53
10000.00
1.00
10-15
92715
399.02
0.43
10000.00
1.00
15-20
13262
159.74
1.20
6892.50
1.20
20-25
2582
69.22
2.68
1391.50
2.68
25-30
592
32.27
5.45
336.50
5.45
30-35
143
15.56
10.88
84.50
10.88
35-40
35
7.73
22.09
20.50
22.09
sum
1477049
28725.50
p_T range (GeV/c)
experiment #event
statistical error
statistical error (%)
simulation #event
statistical error (%)
5-10
1691354
24454.55
1.45
12366.23
0.90
10-15
103326
1491.09
1.44
11144.48
0.95
15-20
14098
291.20
2.07
7326.98
1.17
20-25
2677
123.56
4.62
1442.70
2.63
25-30
605
56.92
9.41
343.89
5.39
30-35
145
27.26
18.80
85.68
10.80
35-40
36
13.71
38.08
21.09
21.78
sum
1812241
32731.04
p_T range (GeV/c)
experiment #event
statistical error
simulation #event
statistical error (%)
5-10
15854394
49214.94
103778.00
0.31
10-15
255105
1343.29
36065.91
0.53
15-20
16559
660.65
628.24
3.99
20-25
2062
168.97
148.93
8.19
25-30
489
63.74
58.85
13.03
30-35
122
28.16
18.77
23.08
35-40
26
13.33
3.80
51.27
sum
16128757
140702.51
p_T range (GeV/c)
prompt photon
statistical error
statistical error (%)
background photon
statistical error
statistical error (%)
5-10
0.81
0.01
1.34
0.10
0.00
1.05
10-15
0.90
0.01
1.38
0.06
0.00
2.22
15-20
0.94
0.02
1.68
0.03
0.01
22.80
20-25
0.96
0.04
3.76
0.10
0.03
27.50
25-30
0.98
0.08
7.67
0.17
0.06
34.58
30-35
0.99
0.15
15.33
0.21
0.12
55.07
35-40
0.97
0.30
31.02
0.23
0.27
118.39
2.2.2 Requirement for Number of Events
In this study, prompt photons were generated with PYTHIA prompt photon
generator by dividing parton reaction p_T range into five range, 2-5
GeV/c, 5-10 GeV/c, 10-20 GeV/c, 20-30 GeV/c and 30-100 GeV/c.
Background photons were generated with PYTHIA QCD jet generator by
dividing parton reaction p_T range into the same five range.
Next tables show the generated prompt photons and background photons for
about 50,000 events generation in each parton reaction p_T range.
prompt photon
prompt photon p_T range (GeV/c)
parton reaction p_T range (GeV/c)
#event
cross section (mb)
luminosity (/pb)
5-10
10-15
15-20
20-25
25-30
30-35
35-40
2-5
71508
1.79E-03
4.00E-02
7403
14
0
0
0
0
0
5-10
50851
6.36E-05
8.00E-01
266811
8864
218
4
0
0
0
10-20
49032
3.06E-06
1.60E+01
159172
333106
61702
4973
438
44
3
20-30
45816
5.73E-08
8.00E+02
8794
31941
220749
414359
117156
12837
1515
30-100
49425
2.47E-09
2.00E+04
5456
9098
19382
56813
303232
527693
181479
sum
447636
383023
302051
476149
420826
540574
182997
QCD jet
background photon p_T range (GeV/c)
parton reaction p_T range (GeV/c)
#event
cross section (mb)
luminosity (/pb)
5-10
10-15
15-20
20-25
25-30
30-35
35-40
2-5
49752
9.95E+00
5.00E-06
36
0
0
0
0
0
0
5-10
41839
1.67E-01
2.50E-04
5655
15
1
0
0
0
0
10-20
48678
4.87E-03
1.00E-02
174731
4807
118
8
0
0
0
20-30
50292
6.29E-05
8.00E-01
1609110
171720
21005
2224
273
22
2
30-100
51159
2.56E-06
2.00E+01
4809728
837076
193787
57276
23721
7103
1593
sum
6599260
1013618
214911
59508
23994
7125
1595
p_T range (GeV/c) prompt photon QCD jet 2-5 7100 220000 5-10 7100 220000 10-20 7100 220000 20-30 120 2900 30-100 5.9 120
3. Simulation of QCD jets in PHENIX Detector System
In most of the spin physics studies, we are interested in the
rare process, such as prompt photon with high transverse momentum, Drell-Yan
production of lepton pairs, and so on. Those cross sections are typically
smaller than QCD jet production, which is the source of background,
by factor of 1E-3. Therefore study of background reduction is one
of the most important areas of the off-line software development.
3.1 QCD jet production in pp collisions at vs=200 GeV
In the lowest order of the QCD process, the jet production is a result
of hard scattering of two partons. Figure 3 schematically shows inclusive
production of hadron C in the the collision of hadron A and
B.
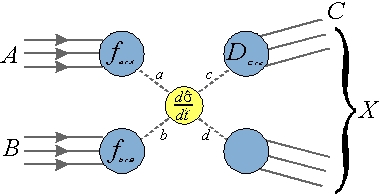
Figure 3 Schematic description of inclusive production of hadron
C
in collision of hadron A and B. "f" stands for structure
function, ab --> cd is the partonic level reaction and D
represents the fragmentation function.
and it decreases drastically along pT as shown in Figure 4. For example,
the jet with p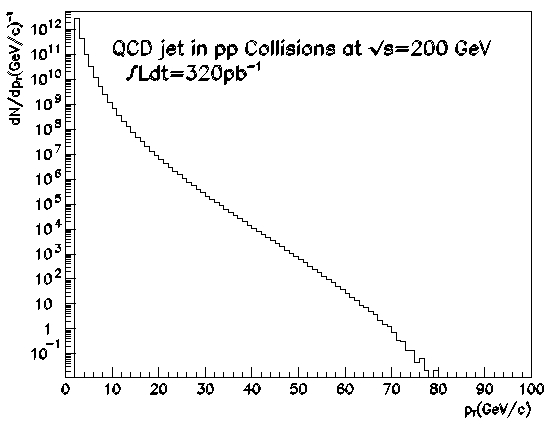
Figure 4 QCD jet production in pp collisions at 200 GeV.
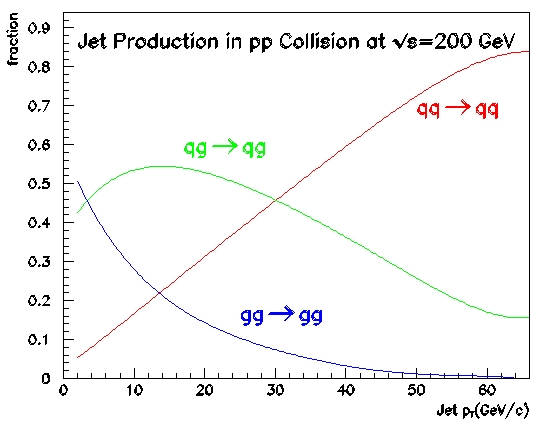
Figure 5 Fraction of contributions from each subprocess to jet
production in pp collision at sqrt(s)=200 GeV.
| Subprocess | Sigma (mb) |
| f + f' -> f + f' (QCD) | 6.330E-01 |
| f + f~ -> f' + f~' | 8.713E-03 |
| f + f~ -> g + g | 9.574E-03 |
| f + g -> f + g | 4.435E+00 |
| g + g -> f + f~ | 1.384E-01 |
| g + g -> g + g | 4.868E+00 |
| total | 1.009E+01 |
Table 1 PYTHIA cross section summary table for jet production
in pp collision at 200 GeV where pT>2.0 GeV/c
Fortunately, we can limit the pT range in the event generation. e.g. 10<pT<11 GeV/c, or 30<pT<31 GeV/c. So 30 GeV/c jet event can be generated as quick as 10 GeV/c. Since natural abundance of 30 GeV/c jet is 1000 times less than 10 GeV/c jet, this method saves CPU time (and data size) by factor of ~1000. Figure 6 compares two methods: one is to generate 100K events without any pT selection, and the other is to generate only 10K events in 20 separate pT bins, e.g. 200K events in total. The former methods could generate QCD jet only upto 20 GeV/c and the latter was successful in generating jet upto 70 GeV/c. Since pT max in 200 GeV collision is 100 GeV/c, this is more than enough. It should be noted that in the low pT region both methods precisely agree as shown in the embedded box.
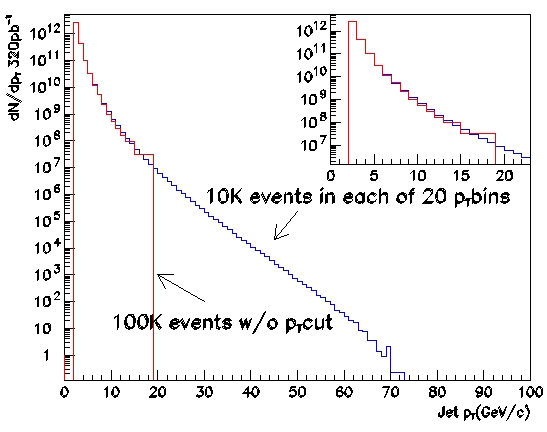
Figure 6 QCD jet calculation in two methods: One without pT
cut but large number of events, the other with pT selection with less number
of events.
When we look at pi0, however, the resulted plot is not very smooth as shown in Figure 7. Obviously some process in the simulation seems limited by statistics. Main difference between jet production and pi0 production is in inclusion of fragmentation function in pi0 production. As shown in Figure 8 the fragmentation function has wide range of value depending on z, which is the fraction of final parton momentum carried by pi0. Indeed, the function ranges from 200 down to 0.01. Since we have another distributions to be folded in to calculate cross sections, such as structure functions and angular distribution of cross sections, 10K events per pT bin is simply not enough. Figure 9 shows results of simulation with pT cut in 49 pT bins. Blue histogram corresponds to 100K per bin and red one does to 10K per bin. Green line is the smooth curve on 100K. In the embedded box, ratios of the differences between histogram and smooth curve to smooth curve for both simulations are shown . So ideally smooth distribution corresponds to "0" which is shown by dotted line. Obviously 100K simulation is by far more smooth.
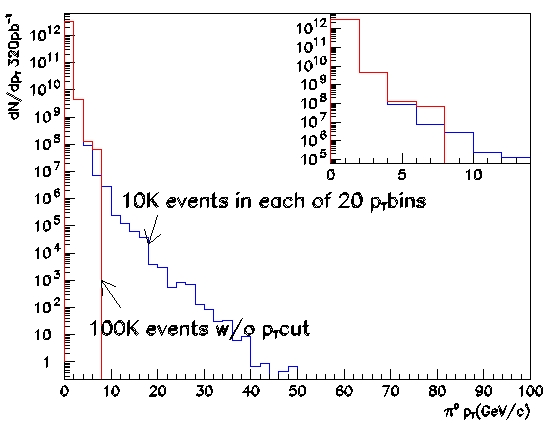
Figure 7 pT distribution of pi0 calculated by two methods. Even for event generation with pT cut, the distribution is not smooth, presumably statistical fluctuation in fragmentation process.
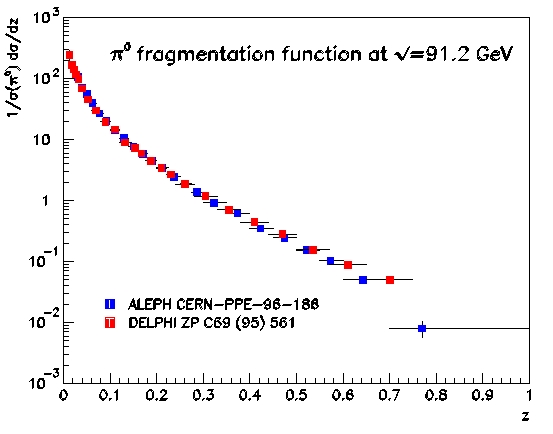
Figure 8 Fragmentation function of pi0 measured in two
experiments at LEP. Both agree well.
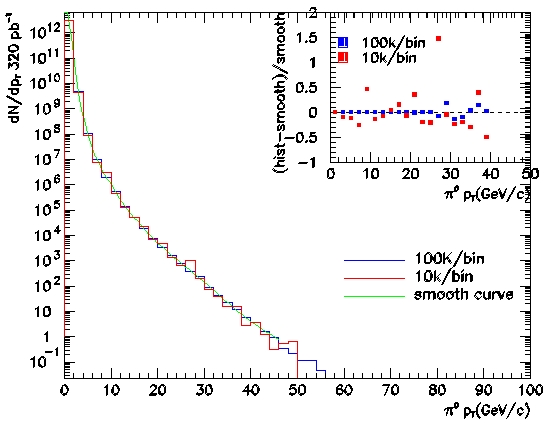
Figure 9 pT distribution of pi0 calculated by two methods; 100K
events per pT bin and 10k events per pT bins.
As discussed in the previous section, simulated results does not have to be smooth as far as the systematic error is negligible size comparing to statistical error. However, model calculations should be smooth ideally. And we need large number of simulations for the process which invlove fragmentation function. For example single muon from open charm production is a result of fragmentation and decay, and it should require large number of events to come up with better model calculation on cross sections and asymmetries.
It should be, however, noted that this kind of simulation does
not have to be fully simulated one, which includes detailed detector responce.
The study can be done with event generator and parametrized detector performance,
such as energy resolution, position resolution, efficiencies and so on.
| CPU Time with 8 SpecInt95 | |
| pT>10 GeV/c | 10.5 sec |
| pT>40 GeV/c | 48.7 sec |
The higher pT threshold is, the more CPU time is required. This is due to the higher particle multiplicity and larger photon energy resulting in longer CPU time for shower development in EM calorimeter. Figure 10 shows multiplicity of charged particle, photon, and pi0 in the PHENIX acceptance. The particle multiplicity increases logarithmically. The CPU time for shower development grows faster than linear in photon energy. We crudely assume overall growth of CPU time is linear in pT.
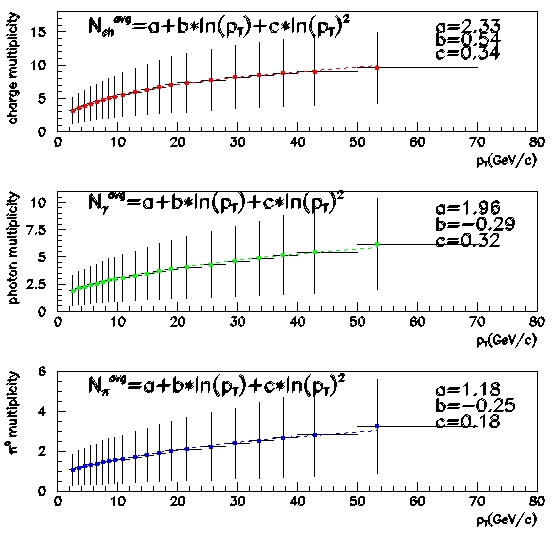
Figure 10 Particle multiplicity of charged particle, photon,
and pi0.
We find CPU time (SPecInt95*sec) = 10.2 *pT - 17.9. Probably this expression
underestimates lower pT but this error is minimal since lower pT jet consumes
small CPU time anyway. Following table summarizes required CPU time for
QCD jet simulations.
| p_T range (GeV/c) | CPU time/event (SpecInt95*sec) | # of events | CPU time (SpecInt95*sec) |
|
2-5
|
2.5
|
220K
|
550K
|
|
5-10
|
33.1
|
220K
|
7282K
|
|
10-20
|
84.0
|
220K
|
18480K
|
|
20-30
|
185.9
|
2900
|
539K
|
|
30-100
|
287.8
|
120
|
35K
|
|
total
|
26886K = 27M
|
Consequently, the required CPU time for the QCD jet process is 27M SpecInt95*sec.
This is only for Central Arm and for the entire PHENIX detector, we
have to add Muon Arm portion, which is known to be more CPU intensive by
factor of 6. Finally the total CPU requirements for simulation for QCD
jet production is: 189M SpecInt95*sec. We will need to complete this
kind of simulation in 2 months (5.2 M sec) for timely publication of the
results. We expect one big run of this sort per year to reflect
(a) improved knowledge on detector performance
(b) new configuration of detector
(c) different beam energies, e.g. sqrt(s)=500 GeV
Thus we need 36 SpecInt95, even in 100% efficient environment. Assuming
80% efficiency of the CPU utilization, 45 SpecInt95 will be the required
CPU for spin physics simulations.
As for the model calculations, we will easily eat up the planned CPU
(10K SpecInt95) if we do full simulations for required 100K events. However,
such simulation can be done with only event generator and some parametrized
detector performance, which should require negligible CPU comparing to
full simulations.
(50+25)sec *8.6 SpecInt95 = 645 SpecInt95*sec per event
We expect similar CPU time for Muon Arms. However we foresee significant reduction of computing time especially simplifying the data conversion process and so on and we would expect ~300 SpecInt95*sec per pp event in Central Arm, and another ~300 SpecInt95*sec per pp event in Muon Arm. Since we have 600K simulated events, we need 360M SpecInt95*sec. Assuming 80% efficiency and 2 months for completion,. we need 85 SpecInt95 of CPU.
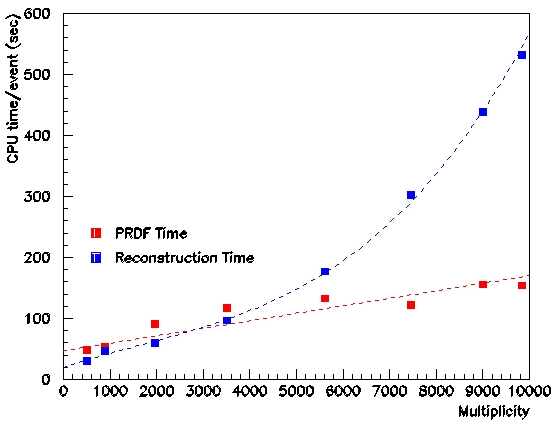
Figure 11 Elapsed CPU time for data conversion to PRDF and reconstruction with 8.6 SpecInt95 CPU obtained from MDC-1.
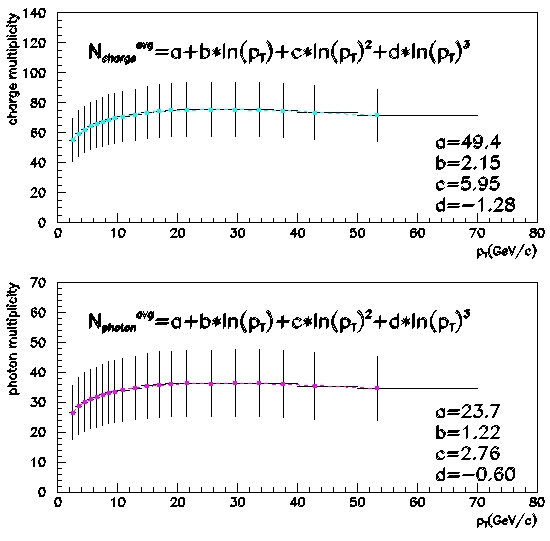
Figure 12 Total charged and photon multiplicity as functions
of pT of reaction.
In this Appendix, the connectivity between BNL and Japanese PHENIX collaborating institutes are described. Following figure show the ESnet Backbone in 1998. BNL is connected at T3 (45 Mbps) to the ESnet(http://www.es.net/).
 There are several PHENIX collaborating institutes in Japan. Some of
them belongs to the Science and Technology Agency (STA) and the
others belong to the Ministry of Education (MOE). STA operates
Inter Ministry Network (IMnet) and has its own Japan-US leased
line (see www.imnet.ad.jp). Also MOE operates Science Information
Network (sinet) and has own Japan-US leased line. HEPNET-J is
operated at KEK and shares the Japan-US leased line of sinet.
There are several other networking providers which PHENIX collaborating
institutes are using. As a result there are several US-Japan leased
lines between BNL and Phenix institutes in Japan.
There are several PHENIX collaborating institutes in Japan. Some of
them belongs to the Science and Technology Agency (STA) and the
others belong to the Ministry of Education (MOE). STA operates
Inter Ministry Network (IMnet) and has its own Japan-US leased
line (see www.imnet.ad.jp). Also MOE operates Science Information
Network (sinet) and has own Japan-US leased line. HEPNET-J is
operated at KEK and shares the Japan-US leased line of sinet.
There are several other networking providers which PHENIX collaborating
institutes are using. As a result there are several US-Japan leased
lines between BNL and Phenix institutes in Japan.
CC-J is planning to use the APAN as the primary connection between Japan and US, because of its large bandwidth and capability. Following figure show the current topology of the BNL and PHENIX-J institutes.

The next figure shows the topology of the APAN. In USA side, APAN is connected to the ESnet at STAR TAP point which is located at Chicago. STAR TAP stands for Science, Technology And Research Transit Access Point and is a persistent infrastructure, funded by the NSF CISE Networking and Communications Research and Infrastructure division, to facilitate the long-term interconnection and interoperability of advanced international networking in support of applications, performance measuring, and technology evaluations. The STAR TAP anchors the international vBNS connections program. (see http://www.startap.net) The Routing between ESnet and APAN at START TAP stated in November 1998.

